
Figure 3.
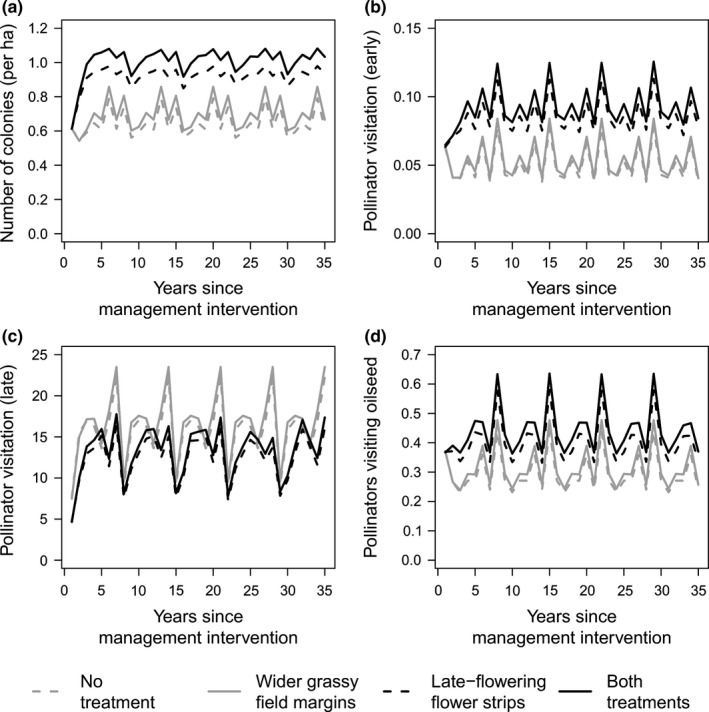
Effect of management interventions on the mean number of bumble bee colonies per hectare (a), pollinator visitation per flower cover per hectare early (b) and late (c) in the season, as well as on oilseed rape (d), depicted for a single landscape. Repetition in patterns across the 35 years time is due to the fivefold repetition of an underlying 7‐year time series which has slight year‐to‐year differences in resources due to crop rotation