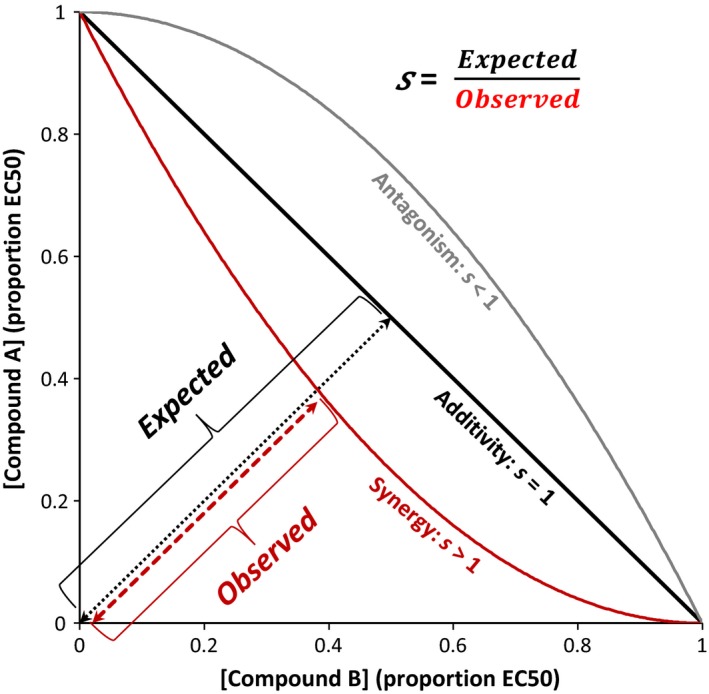
Figure 1.

Schematic depicting the shapes of growth isoclines for different patterns of interaction. Interactions between the two compounds are quantified by the parameter s, which reflects the ratio of the Expected to Observed concentrations that result in 50% inhibition. The solid black line represents the shape of the growth isocline under the null hypothesis of additivity, corresponding to s = 1. The red parabola depicts the concave shape of the isocline when there is synergy between the two compounds (Expected > Observed, s > 1), whereas the gray parabola depicts a convex isocline, which occurs when the compounds have antagonistic effects (s < 1). For clarity, the distance Observed is only shown for the case of synergy
