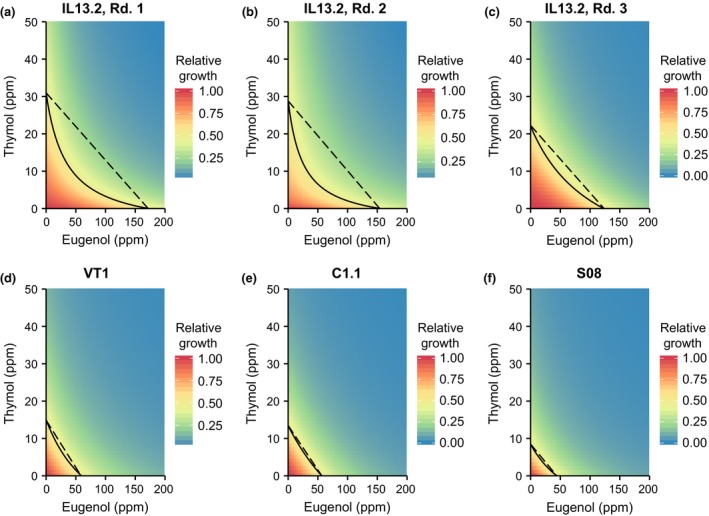
Figure 2.

Combinatorial effects of eugenol and thymol against C. bombi strains tested in series over six experiments. Panels show the results of six separate experiments in separate weeks: three with C. bombi strain IL13.2—referred to as “Rounds 1–3,” and one each with strains VT1, C1.1, and S08. The solid line shows the isocline of 50% growth inhibition. The dashed line that connects thymol EC50 (y‐intercept) and eugenol EC50 (x‐intercept) represents the expected growth isocline if the compounds have additive effects. Concave isoclines indicate synergistic effects (see Figure 1). The plot area is color‐coded according to the predicted growth at any given vector of concentrations, with red indicating highest growth and blue indicating least growth. Growth was measured as the 5‐day growth integral, i.e., area under the curve of net OD versus time. Within each panel, growth is scaled relative to growth in the absence of phytochemicals, such that maximal growth is always equal to 1. For absolute growth measurements, refer to Figure 4d: Maximum growth. Each experiment included n = 216 samples (six replicate wells at each of 36 combinations of eugenol and thymol). Rd.: round. ppm: parts per million
