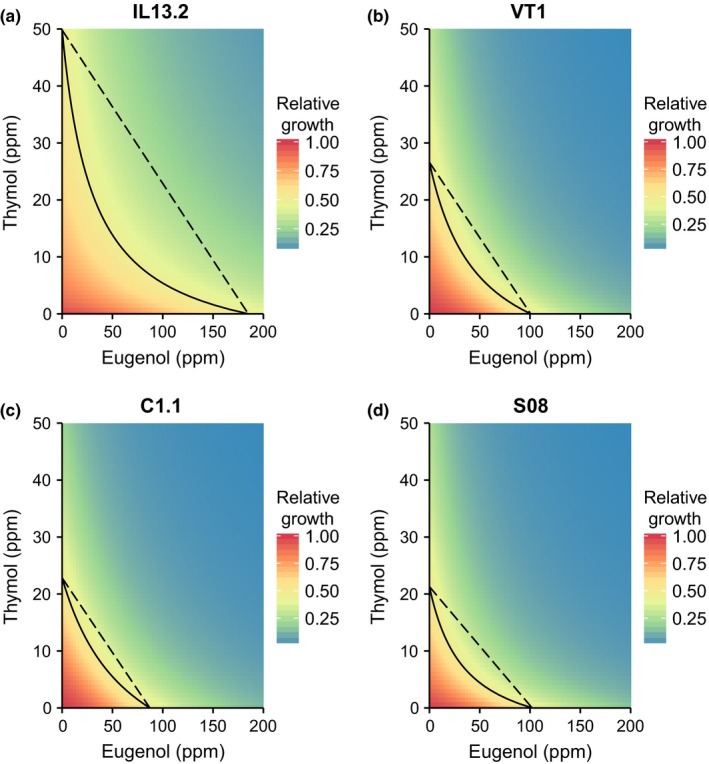
Figure 3.

Combinatorial effects of eugenol and thymol against four C. bombi strains, assayed in parallel. As in Figure 2, the solid line shows the isocline of 50% growth inhibition. The dashed line that connects thymol EC50 (y‐intercept) and eugenol EC50 (x‐intercept) represents the expected growth isocline if the compounds have additive effects. Concave isoclines indicate synergistic effects (see Figure 1). Tests of each strain included n = 72 samples (two replicate wells at each of 36 combinations of eugenol and thymol). ppm: parts per million
