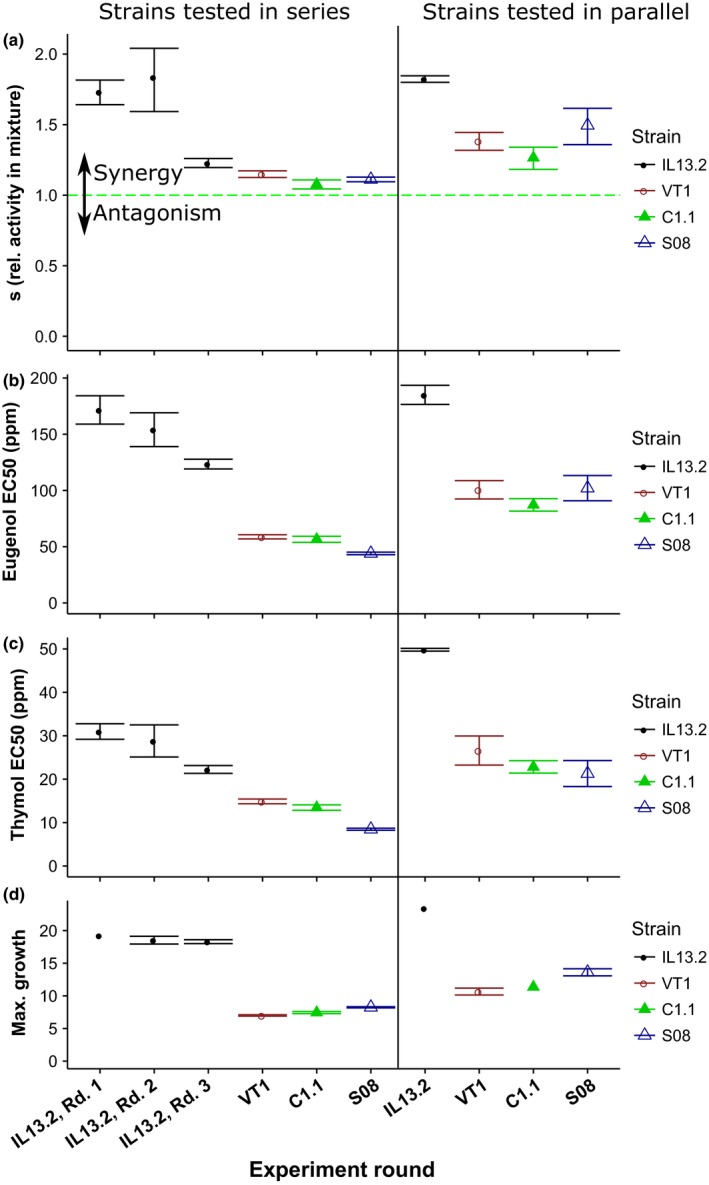
Figure 4.

Universal Response Surface Analysis model parameters across all experiments. The y‐axis shows the round of the experiment. The first six experiments were conducted on strains tested singly in series, with three experiments on strain IL13.2 (“Rounds 1–3”) and one experiment each on strains VT1, C1.1, and S08. The final four experiments were conducted on all four strains tested in parallel, i.e., strains were tested concurrently. The vertical line divides the experiments conducted in series from the experiments conducted in parallel. The x‐axis shows model estimates and 95% CIs for four parameters: (a) s is the interaction parameter from equation (3), which indicates the relative potency of each compound in mixture versus in isolation. Values s > 1 indicate synergy. The null hypothesis of additivity is indicated by the dashed green line. (b) Eugenol and (c) thymol EC50s are the individual phytochemical concentrations necessary for 50% growth inhibition. (d) Max. growth shows growth in the absence of phytochemicals, i.e., at a concentration of 0 ppm. The legend indicates color coding of points and confidence intervals by strain. Where no error bars are shown for maximum growth, this parameter was fixed as the average of growth in control samples exposed to 0 ppm phytochemicals
