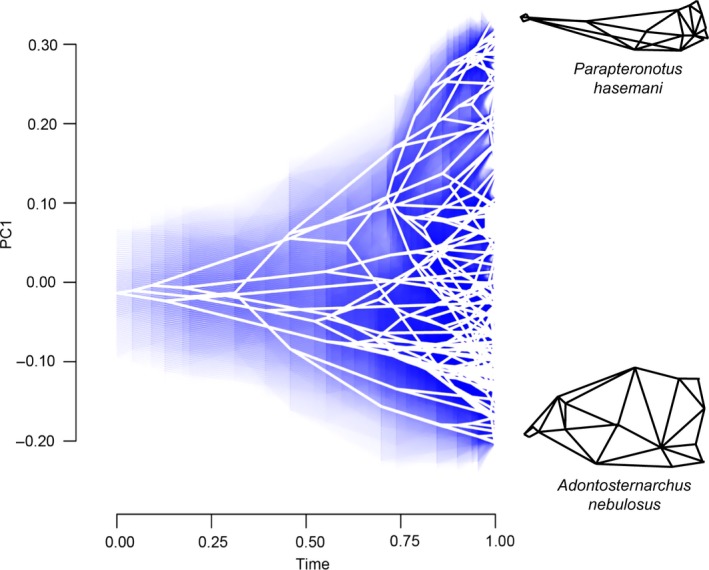
Figure 6.

Phenogram of heterocephalic evolution for 133 gymnotiform species plotted against time. Phylogeny based on Tagliacollo et al. (2015). Note multiple independent colonizations of both low (brachycephalic) and high (dolichocephalic) PC1 scores. Blue shading indicates 95% confidence limits. Wireframe drawings illustrate skulls with extreme neurocranial shapes
