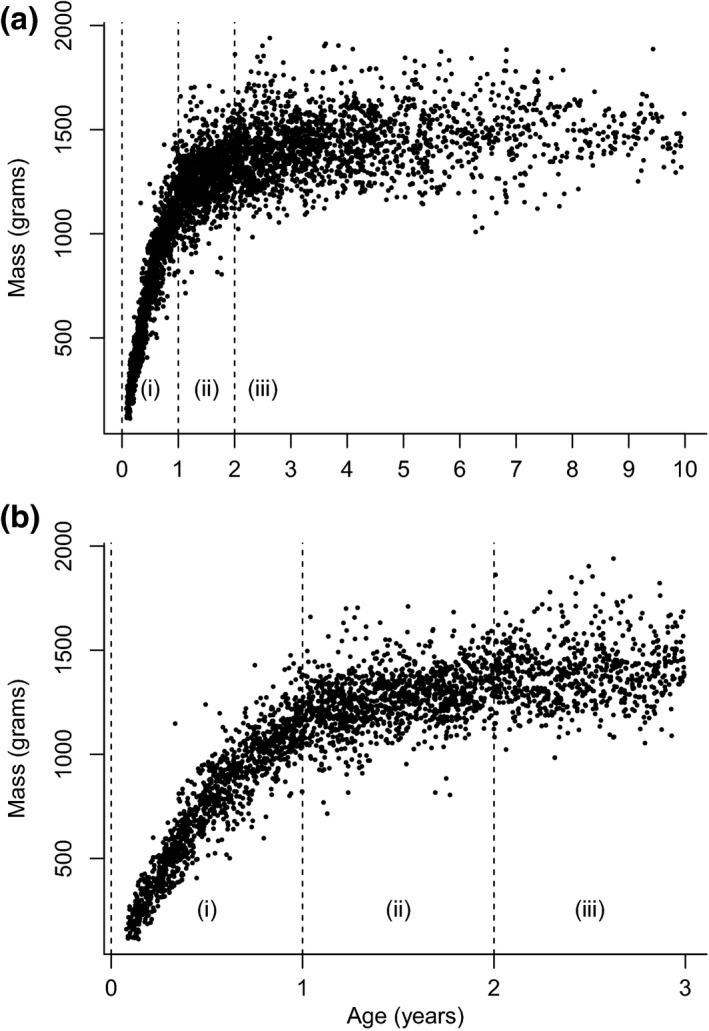
Figure 2.

Banded mongoose mass change with age. Panel (a) shows all data and panel (b) zooms in on data from individuals between the ages of 0 and 3 years. In both panels, the vertical dotted lines divide the data into masses from individuals aged 0 to 1 year (zone i), 1 to 2 years (zone ii) and over 2 years (zone iii)
