Figure 4.

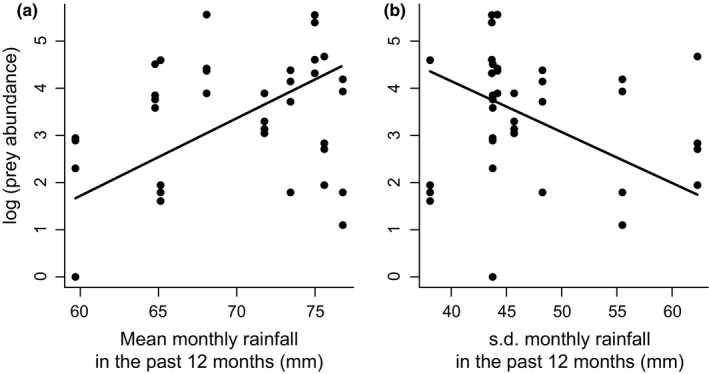
The effect of (a) the mean and (b) the standard deviation of monthly rainfall in the past 12 months on invertebrate prey abundance. Note the log scale on the y axis

The effect of (a) the mean and (b) the standard deviation of monthly rainfall in the past 12 months on invertebrate prey abundance. Note the log scale on the y axis