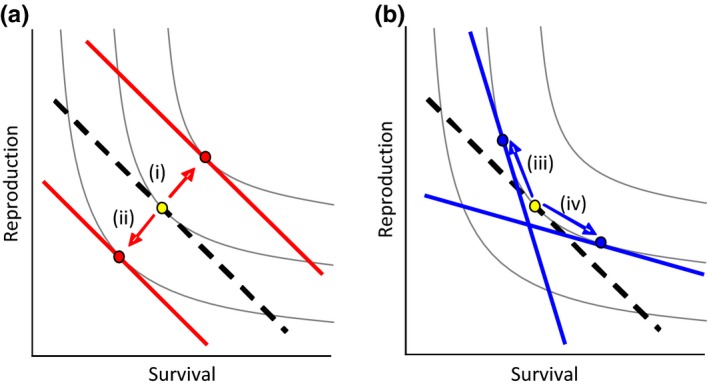
Figure 6.

Graphical illustration of the hypothesized effect of changes in the (a) variability and (b) mean of early‐life rainfall on life‐history trade‐off and allocation patterns (after Saeki et al., 2014). The thin gray lines represent fitness isoclines along which all positions return an equal payoff. The thick dashed line represents the reference trade‐off slope for an individual (here straight lines for simplicity), and the yellow dot represents the reference optimal allocation of resources to survival and reproduction (where the trade‐off slope is tangential to the isocline). In panel (a), the thick red lines and dots show how an (i) increase or (ii) decrease in the variability of early‐life rainfall relaxes or increases the life‐history trade‐off constraints leading to higher or lower fitness payoffs. In panel (b), the thick blue lines and dots represent how an (iii) increase or (iv) decrease in mean early‐life rainfall leads to changes in an individual's trade‐off slope and optimal allocation of resources but no change in their overall fitness payoff
