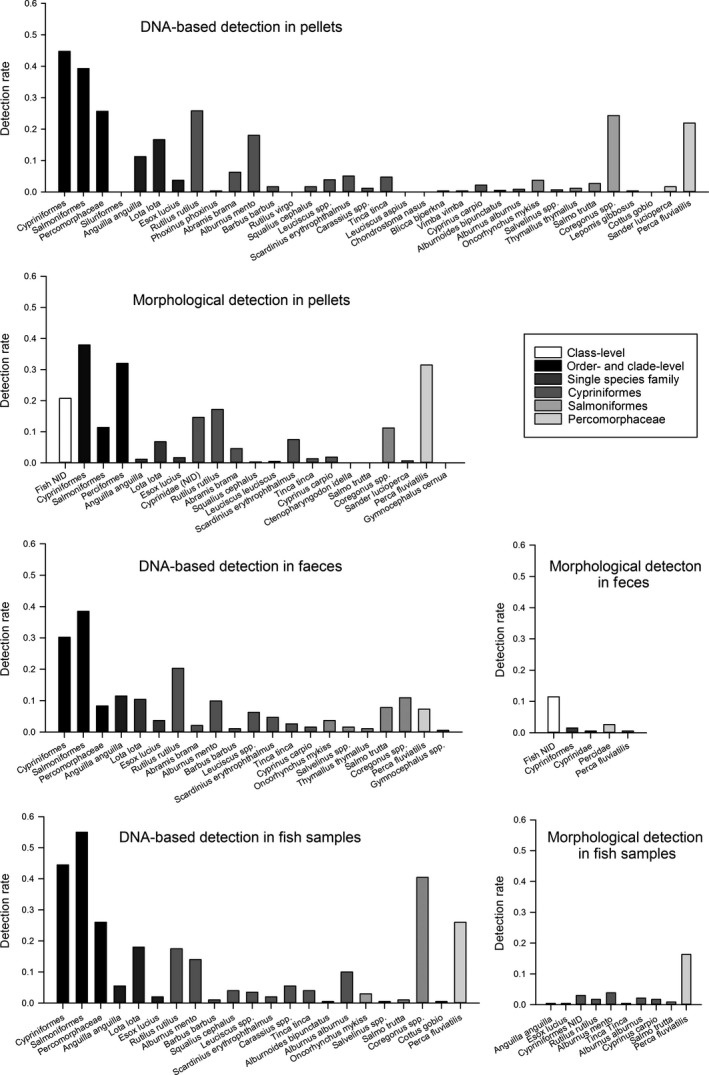
Figure 3.

DNA‐based and morphological detection rates per prey taxon for pooled pellets, feces, and fish samples collected in a cormorant colony at Chiemsee (Bavaria, Germany) during two breeding seasons. Color codes for different taxonomic levels of identification and affiliation in Alpine foreland freshwaters; detections at the order level can result from more than one taxon per sample; thus, species and genus detection rates do not add up to order‐level detection rates
