Figure 3.

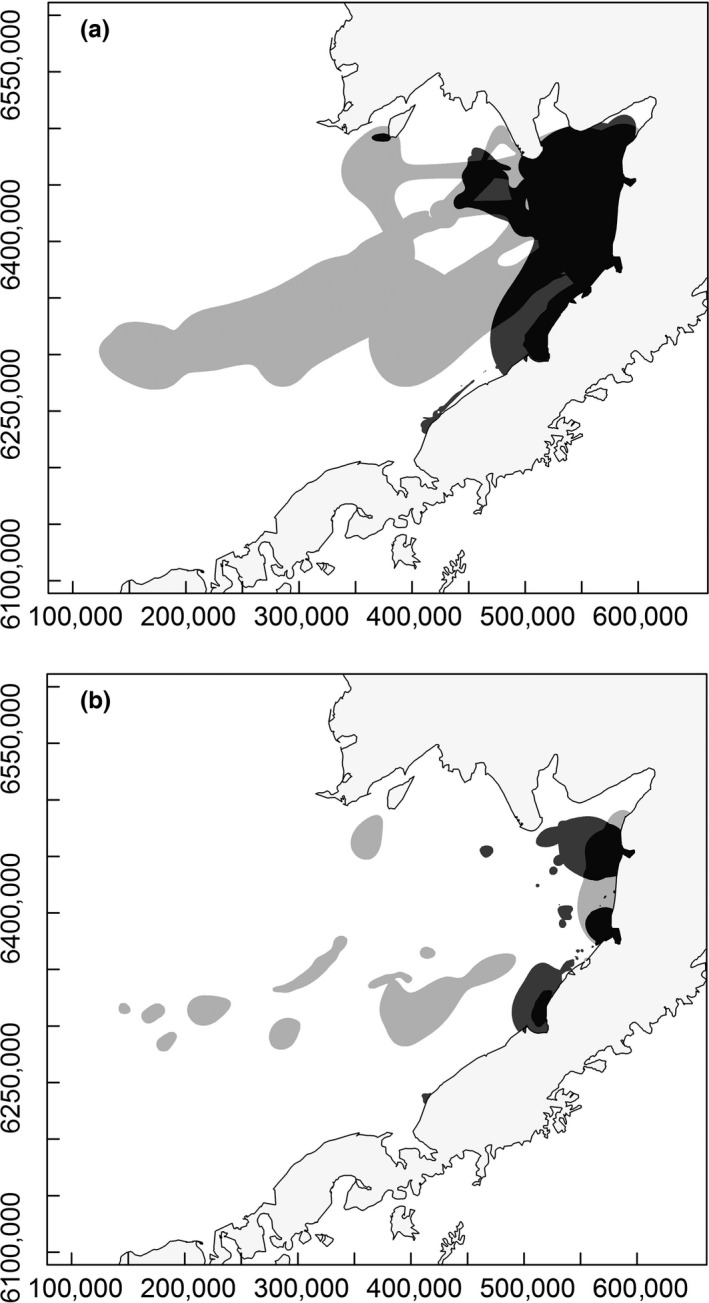
Kernel Brownian bridge (a) 90% and (b) 50% utilization distributions for all harbor seals (medium gray) and spotted seals (light gray) with the areas of overlap indicated in dark gray

Kernel Brownian bridge (a) 90% and (b) 50% utilization distributions for all harbor seals (medium gray) and spotted seals (light gray) with the areas of overlap indicated in dark gray