
Figure 5. Loss of Gadd45a does not affect the number of Normal Hematopoietic stem cells as well as homing and engraftment of bone marrow cells.
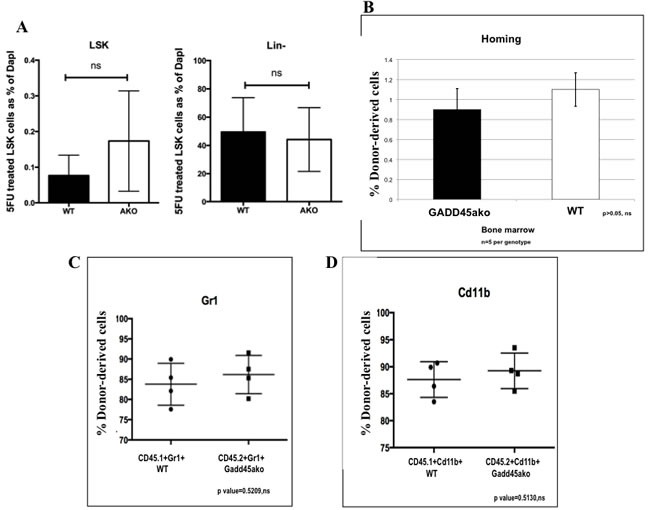
A. Bar graph representation of flow cytometric data showing average LSK cells from 6 independent experiments. Differences between normal stem cells in WT and Gadd45a−/− mice were not significant. P > 0.05 B. FACS of donor derived CD45.2 (WT or Gadd45a−/−) cells in CD45.1 mice, 3 hrs post BMT. Bar graph shows average percent CD45.2 cells from 3 independent experiments (n = 5 per genotype). Bars ± SEM P > 0.05 C.&D. Summary of flow data from competitive repopulation experiments showing Gr1 and CD11b myeloid markers CD45.1+Gr1+, CD45.2+Gr1+ve, CD45.1+cd11b+ and CD45.2+cd11b+ve cells. P > 0.05 Results are representative of 3 independent experiments in each group (n = 4 per genotype).