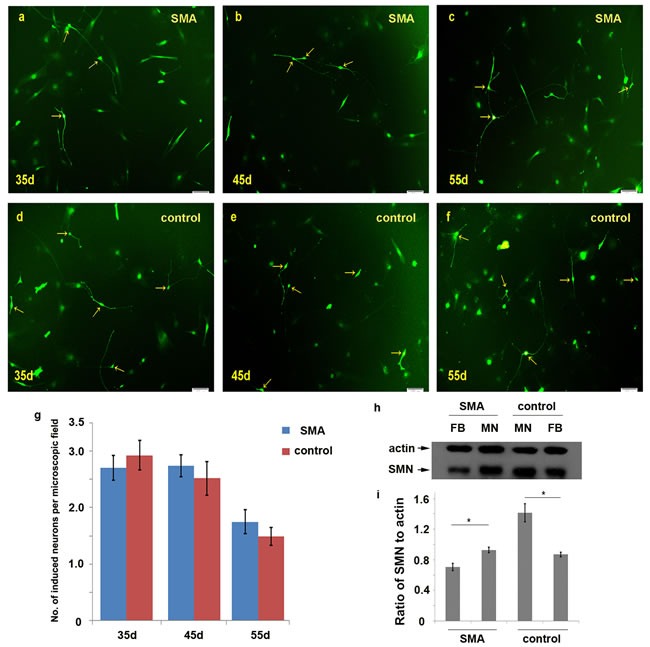
Figure 3. Comparison of the numbers of induced motor neurons in 10× microscopic fields between the SMA and control group.

a.-f. The induced neurons observed per microscopic field on days 35, 45 and 55 in the SMA and control groups. g. The average numbers of induced neurons in the SMA and control groups. The data are expressed as the means ± the SEMs. The arrow indicates an induced neuron. h.-i. The SMN protein levels were significantly increased in motor neurons compared with fibroblasts detected by Western blot on day 50. SMN protein levels to actin were expressed as the mean±SEM: SMA-FB, 0.71±0.05; SMA-MN, 0.93±0.03; control-MN: 1.41±0.12; control-FB: 0.87±0.03. FB: fibroblast. MN: motor neuron. * P < 0.05. Scale bars, 100 µm
