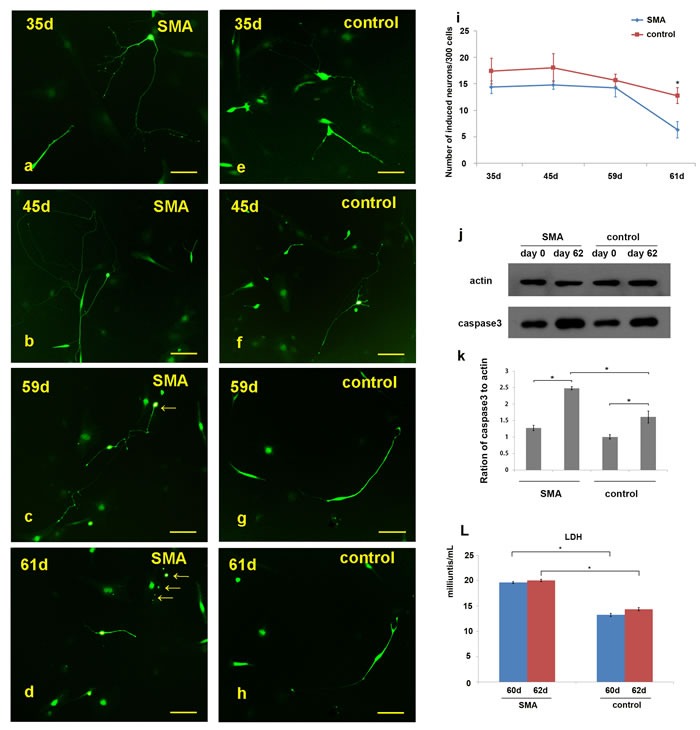
Figure 5. Observation of neuronal degeneration under a fluorescence microscope.

a.-h. Morphological changes in the neurites of the SMA and control neurons were dynamically observed. “c.-d.” and “g.-h.” show the same neurons in the microscopic fields. i. Statistical analysis of the induced neurons per 300 cells revealed the following results: 14.4±1.2 (SMA-35 d), 14.8±0.8 (SMA-45 d), 14.2±1.6 (SMA-59 d), 6.3±1.5 (SMA-61 d), 17.4±2.4 (control-35 d), 18.0±2.6 (control-45 d), 15.7±1.2 (control-59 d), and 12.8±1.5 (control-61 d). j.-k. The caspase 3 levels in SMA group compared with control group on day 62. Caspase3 protein levels to actin were expressed as the mean±SEM: SMA-day 0, 1.27±0.08; SMA-day 62, 2.48±0.05; control-day 0: 1.00±0.06; control-day 62: 1.61±0.18. l. The lactate dehydrogenase (LDH) activity detected between SMA and control group at day 60 and day 62. LDH activity was expressed as the mean±SEM: SMA-day 60, 19.63±0.19; SMA-day 62, 20.04±0.22; control-day 60: 13.23±0.33; control-day 62: 14.37±0.31. * P < 0.05. Scale bars, 100 µm
