
Figure 1. Flow cytometry based screen for compounds that increase DNA damage in S-phase when combined with Wee1 inhibition.
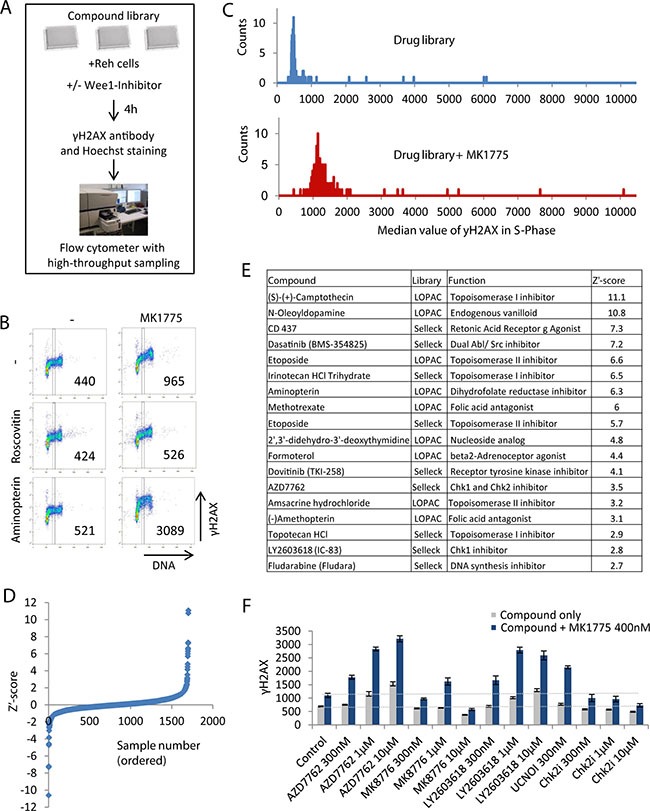
(A) Illustration of screen setup. (B) Example of screen results. Density scatter plots are shown for γH2AX versus Hoechst staining (DNA). Vertical lines indicate the region used for quantification of γH2AX levels in S-phase, and numbers indicate median γH2AX levels within this region. (C) Example of screen results for a pair of single 384-well plates treated with drug library only (top) and drug library plus 400 nM MK1775 (bottom). The histograms show counts versus γH2AX median values in S-phase. γH2AX median values were obtained as in (B). (D) Z’-score values for γH2AXdiff calculated as described in materials and methods. (E) List of candidate hits giving synergistic induction of γH2AX in S-phase when combined with MK1775. The compounds with the highest Z’ score in the screen are shown. (F) Validation of the results of combined Chk1 and Wee1 inhibition. Reh cells were treated with the indicated concentrations of Wee1 (MK1775), Chk1 (AZD7762, LY2603618, UCN01, MK8776) and Chk2 (PV1019, denoted Chk2i) inhibitors and examined by automated flow cytometry analysis as in A and B. Results are average of three replicates from a representative experiment (three independent experiments gave similar effects). Error bars represent standard deviation. Validation of additional candidate hits is shown in Figure S1D.