
Figure 2. Combined Wee1 and Chk1 inhibition synergistically enhances replication catastrophe.
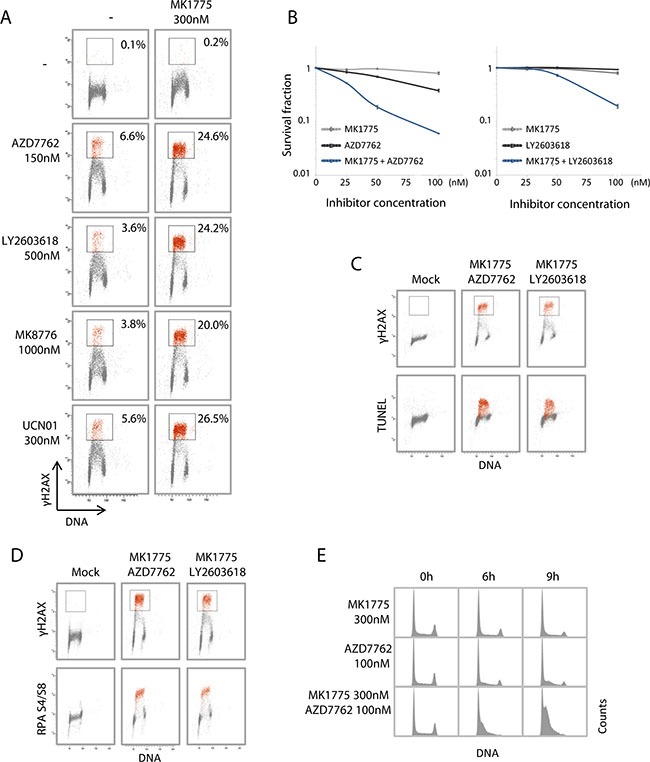
(A) Flow cytometric analysis of U2OS cells treated for 3 hours with the Wee1 inhibitor MK1775, either of the Chk1 inhibitors AZD7762, LY2603618, MK8776, UCN01, or the combination of MK1775 with each of the Chk1 inhibitors. Scatter plots of γH2AX versus Hoechst (DNA) are shown from a representative experiment. Numbers are the percentage of cells within the indicated region with strong γH2AX signal (red color). (B) Clonogenic survival of U2OS cells treated with MK1775 and/or AZD7762 (left) or MK1775 and/or LY2603618 (right), at concentrations 0, 25, 50 or 100 nM for 24 hours. Average survival fractions from three independent experiments are shown. Error bars: SEM (n = 3). (C) U2OS cells treated with a combination of MK1775 (300 nM) and AZD7762 (150 nM) or LY2603618 (500 nM) for 3 hours were processed for simultaneous flow cytometric analysis of γH2AX and the TUNEL assay. Scatter plots of γH2AX versus Hoechst (DNA) (top panel) and TUNEL versus Hoechst (bottom panel) are shown. A region defined based on cells with strong γH2AX signals is shown in red color. (D) U2OS cells treated as in C processed for simultaneous flow cytometric analysis of γH2AX and phospho-RPA (Ser4/Ser8). A region defined based on cells with strong γH2AX signals is shown in red color. (E) U2OS cells treated with MK1775 or AZD7762 or the combination of the two inhibitors as indicated, were stained with Hoechst and analyzed by flow cytometry. DNA histograms are shown.