
Figure 3. S-phase CDK activity poorly correlates with the extent of DNA damage after Chk1/Wee1 inhibition.
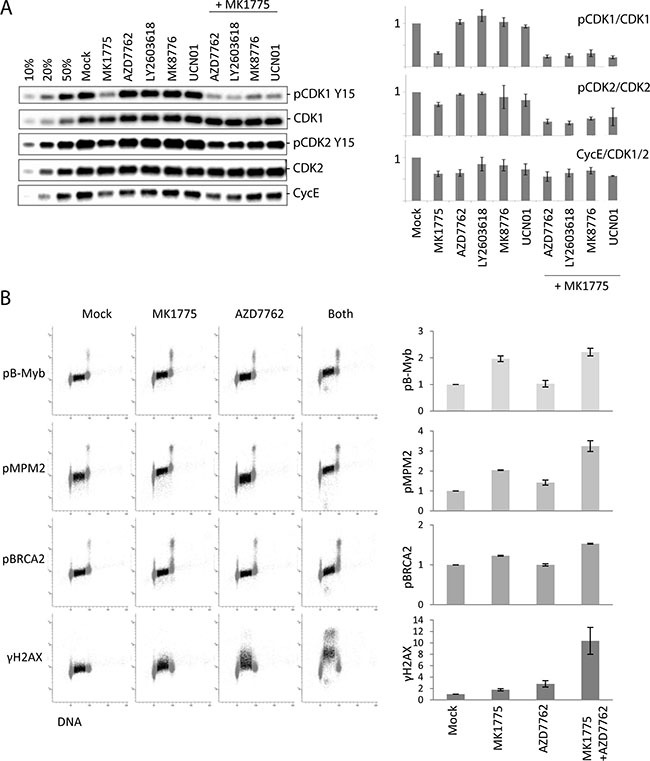
(A) Left: Immunoblot analysis on parallel samples within the same experiment as in Figure 2A collected at one hour after treatment. U2OS cells were exposed to MK1775 (300 nM) and/or AZD7762 (150 nM), LY2603618 (500 nM), MK8776 (1000 nM) and UCN01 (300 nM) for 1 hour. 10%, 20% and 50% of the non-treated sample (Mock) were loaded in the three first lanes to measure the dynamics for each antibody, respectively. Right: Quantifications of phospho-CDK1 (Tyr15) (relative to CDK1), phospho-CDK2 (Tyr15) (relative to CDK2), and Cyclin E levels (relative to CDK1 or CDK2). Error bars: SEM (n = 2 or 3). (B) Flow cytometric analysis of CDK-dependent phosphorylations compared to γH2AX in S-phase cells. U2OS cells were treated with MK1775 (600 nM), AZD7762 (100 nM) or both MK1775 (600 nM) and AZD7762 (100 nM) for 1 hour, or left untreated (Mock). The four samples were bar-coded with Pacific Blue before antibody staining with the indicated antibodies. S-phase cells are indicated in dark color. Graphs show average median values in S-phase (relative to Mock) from three independent experiments. Error bars: SEM (n = 3).