
Figure 4. Loading of the replication initiation factor CDC45 after Wee1 inhibition is restrained by Chk1.
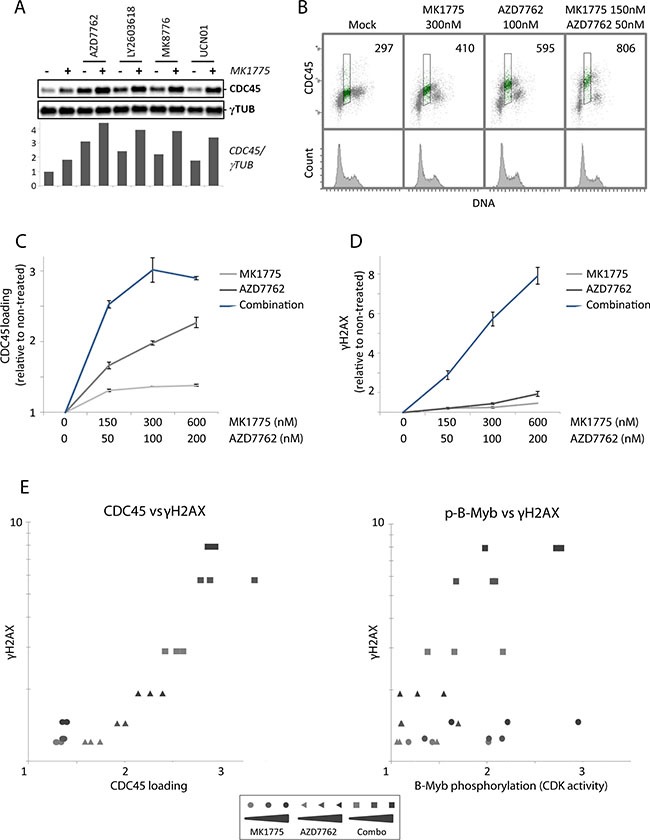
(A) Immunoblot analysis of pre-extracted U2OS cells, treated with MK1775 (150 nM) and/or AZD7762 (50 nM), LY2603618 (250 nM), MK8776 (125 nM) or UCN01 (150 nM) for one hour. Bottom: Quantification of CDC45 levels relative to γ-tubulin (γTUB) levels. Results are from a representative experiment. (B) Flow cytometric analysis of U2OS cells treated with MK1775, AZD7762 or the combination of the two inhibitors for 1 hour. Cells were pre-extracted before fixation, bar-coded with pacific blue, and stained with anti-CDC45 antibody and the DNA stain FxCycle Far Red. Numbers indicate median CDC45 signals in S-phase (region shown in green). (C) Median CDC45 values in S-phase U2OS cells treated with MK1775 (0, 150, 300, 600 nM) and/or AZD7762 (0, 50, 100, 200 nM) for 1 hour. Pre-extraction, staining and flow cytometric analysis were performed as in B. Error bars: SEM (n = 3). (D) Median γH2AX values of S-phase U2OS cells treated with MK1775 and/or AZD7762 for 1 hour similarly as in C. After fixation, the cells were barcoded, stained with anti-γH2AX antibody and the DNA stain FxCycle Far Red, and analyzed by flow cytometry. Error bars: SEM (n = 3). (E) Examination of the correlation between CDC45 loading and γH2AX, and CDK activity (as measured by phospho-B-Myb) and γH2AX, for the results shown in C, D and Figure S4C. The values of γH2AX from D were plotted versus the CDC45 values from C (left), or against the p-B-Myb values from Figure S4C (right).