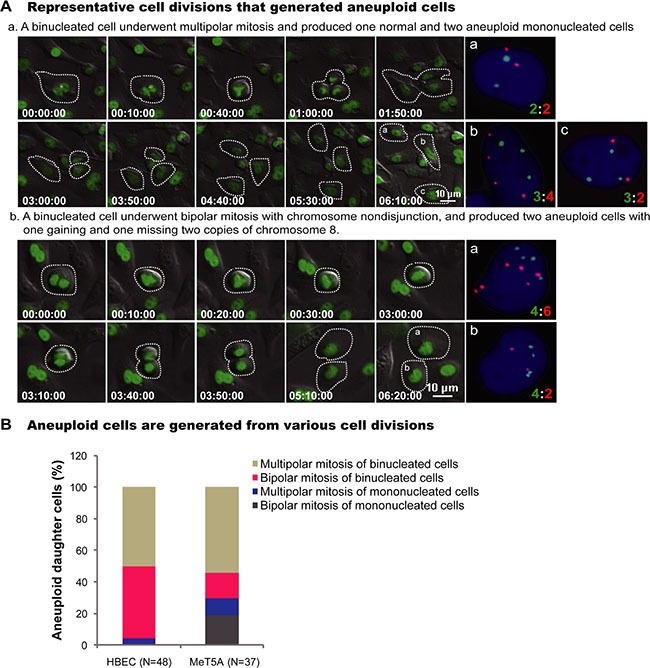
Figure 2. Representative cell divisions generating aneuploid cells.

(A) Serial images showed two representative HBEC cell divisions leading to aneuploid cells: (a) A binucleated cell underwent tripolar mitosis and produced three daughter cells with chromosome 12:8 compositions of 2:2, 3:4 and 3:2, respectively (Supplementary Movie S5); (b) A binucleated cell underwent bipolar mitosis with nondisjunction of chromosome 8, and produced two daughter cells with 4:6 and 4:2 for chromosome 12:8 (Supplementary Movie S6). Time is indicated in hours: minutes: seconds. The number of chromosomes in daughter cells presenting in the last frame of time-lapse imaging was directly assayed by FISH using chromosome 8 (Red) and 12 (Green) -specific probes immediately after live-cell imaging. (B) Quantification of cell divisions that produced aneuploid cells. N, the number of aneuploid daughter cells analyzed. Data were summarized from analysis of FISH signals following long-term live-cell imaging from at least two independent experiments.
