Figure 3.

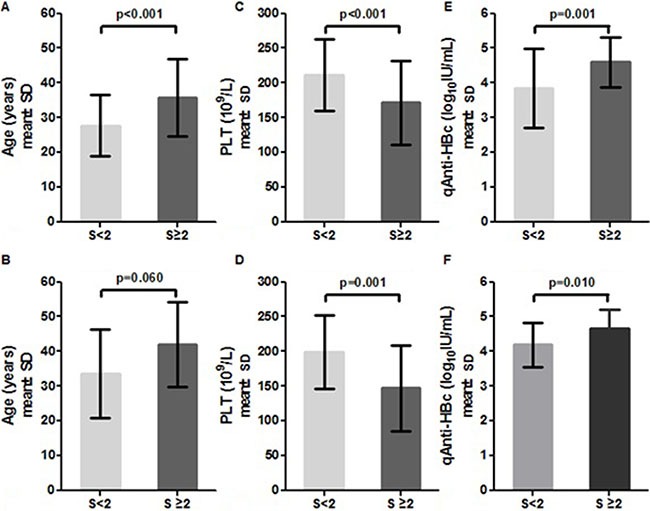
Distribution of age, PLT and qAnti-HBc levels in HBeAg (+) (A, C, E) and HBeAg (–) patients (B, D, F) stratified by fibrosis stage.

Distribution of age, PLT and qAnti-HBc levels in HBeAg (+) (A, C, E) and HBeAg (–) patients (B, D, F) stratified by fibrosis stage.