
Figure 5. Cluster analysis of CBV and VS correlated genes.
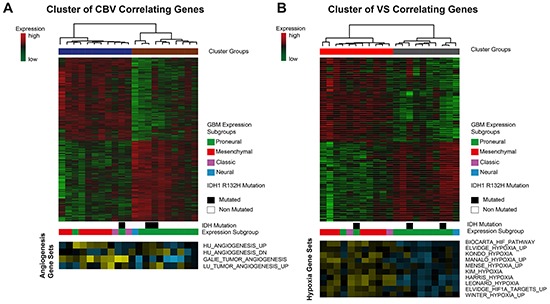
A. CBV-associated genes are clustered by Spearman's rank correlation into two clusters. Bars below the heatmap describe IDH1-status and expression subgroup of each patient. The heatmap at the bottom shows different angiogenesis pathways and their enrichment in each patient. (yellow: high enrichment, blue: low enrichment) B. VS-associated genes are clustered by Spearman's rank correlation into two clusters. Bars below the heatmap describe IDH1-status and expression subgroup of each patient. The heatmap at the bottom shows different hypoxia pathways and their enrichment in each patient. (yellow: high enrichment, blue: low enrichment).