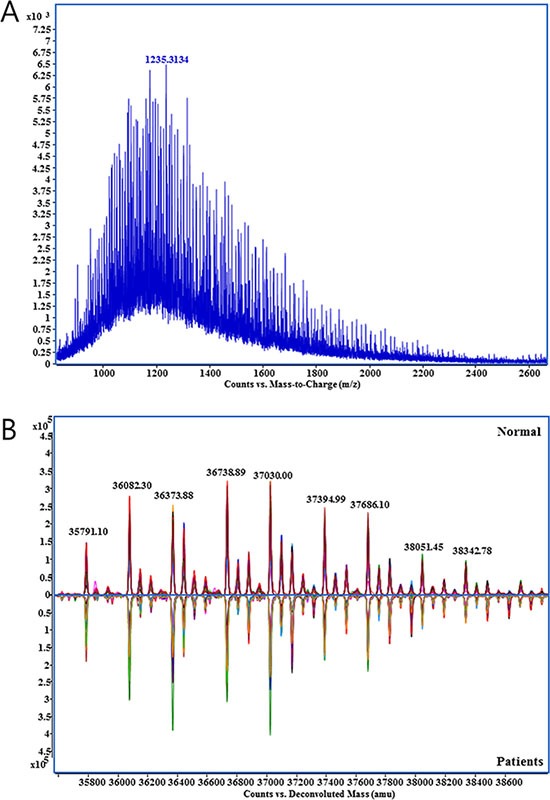
Figure 1. Mass spectrum obtained from the direct analysis of haptoglobin.

(A) Raw mass spectrum with multiply charged haptoglobin glycoforms., (B) Deconvoluted spectrum of haptoglobin glycoforms from healthy control (n = 44, upper) and gastric cancer patient group (n = 44, lower). Specta in each groups were overlaid.
