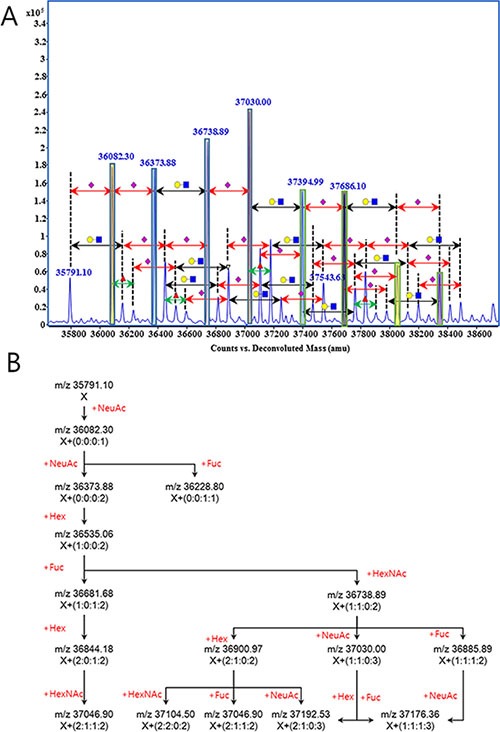
Figure 2. A set of glycan correlation observed in the mass spectrometric analysis of human haptoglobin.

Glycan correlation was displayed on the mass spectrum (A), and illustrated as schematic diagram (B). Symbols in Figure 2(A) were ●, hexose; ◼, N-acetylhexosamine; ▲, fucose; and ◆, N-acetylneuraminic acid. Number in parenthesis on Figure 2(B), are the number of carbohydrate units attached on the molecule X (m/z 35791.10). Number and type of units were calculated from the accurate mass and indicates hexose, N-acetylhexsamine, fucose and N-acetylneuraminic acid from left to right, respectively.
