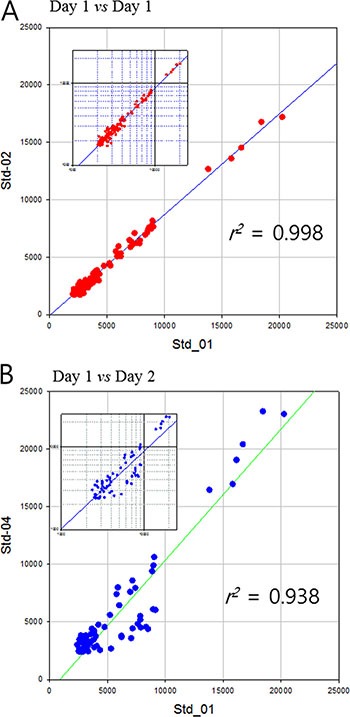
Figure 3. Pearson's correlation of mass spectrometric dataset of standard haptoglobin samples.

(A) analyzed same day and (B) different days. Small graphs are log-log plot to clarify the dispersion of small values.

(A) analyzed same day and (B) different days. Small graphs are log-log plot to clarify the dispersion of small values.