
Figure 1. Histogram showing expression of epigenetic regulatory genes in HK-2 cells exposed to chronic oxidative stress.
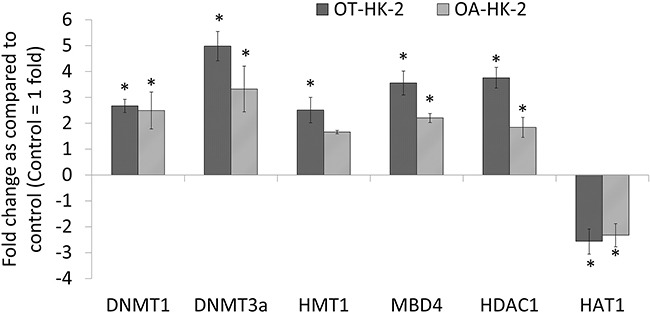
Total RNA isolated from HK-2, OT-HK-2 and OA-HK-2 cells was used to perform one-step real-time quantitative reverse transcription PCR as described in materials and methods. Cycle threshold value (Ct value) of each gene was normalized to the Ct value of housekeeping gene GAPDH from the same sample. The gene expression in fold change was calculated and histogram was plotted using the means of triplicate values. The error bars represent the standard deviation of the mean (±SD). An asterisk (*) indicates statistically significant (p<0.05) change, when compared to control.