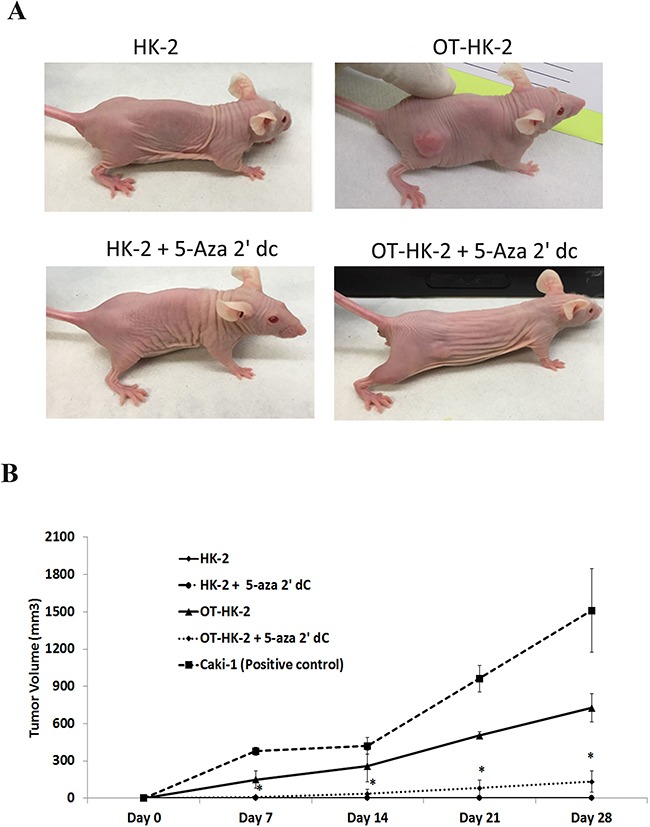
Figure 6. Representative images showing effect of 5-aza 2’ dc on in vivo tumor formation potential of malignantly transformed HK-2 cells.

OT-HK-2 cells and passage matched control HK-2 cells were treated with 5-aza 2’ dc and inoculated subcutaneously into right flank of athymic nude female mice and observed for tumor formation as described in material and method section. All animals were observed for tumor formation daily for 4 weeks. Tumor volume (mm3) was measured in weekly intervals in all the tumor-bearing animals and presented in the graph in comparison to positive control renal cancer cells (Caki-1). In animals injected with HK-2 and HK-2 + 5-aza 2’ dc treated cells, there was no visible tumor formation at the site of injection. Hence tumor volume of “0” is used for both these groups and lines are overlapping on the x-axis of the graph. Each data point represents mean tumor volume ± standard deviation (SD). An asterisk (*) indicates statistically significant (p<0.05) change, when compared to OT-HK-2 cells inoculated animals at respective intervals.
