
Figure 1. Boxplots of KEAP1 promoter methylation levels in Normal Renal tissues (NR), and different renal tumor histologies included into this study, paired with normal renal parenchyma distant from tumor.
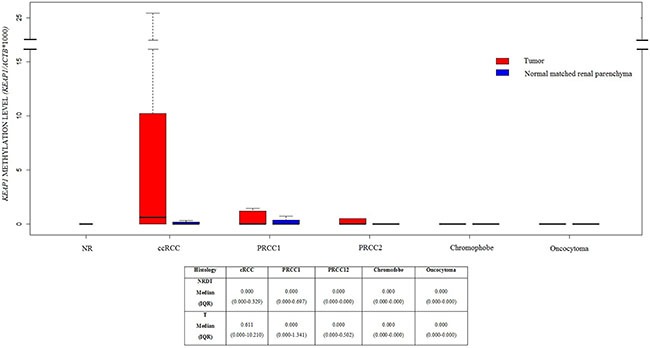
Methylation levels are expressed as the (KEAP1/ACTB)*1,000. The boxes mark the interquartile range, (interval between the 25th and 75th percentile). ccRCC, clear cell Renal Cell Cancer; PRCC1, Papillary Renal Cell Carcinoma Type 1; PRCC2, Papillary Renal Cell Carcinoma Type 2.