
Figure 2. The 450 K methylation array data from the TCGA demonstrates that methylation of the KEAP1 promoter region is a hallmark in ccRCC.
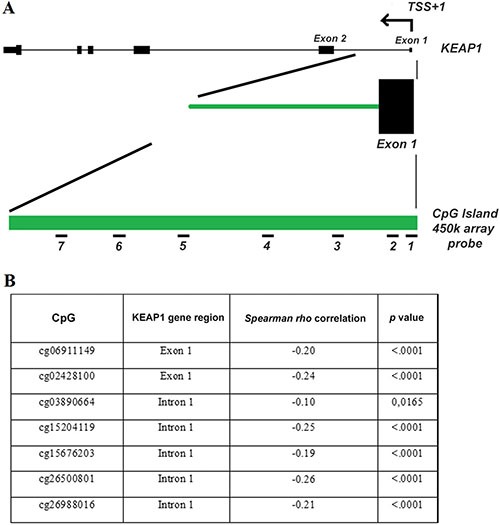
(A) The KEAP1 gene structure, including its transcription start site (TSS), exons (black boxes) and introns (lines), a 1.2-kb CpG island of the KEAP1 gene (green bar) and the location of the probes present on the 450 K array (short black numbered lines, denoted as probes 1-7 for target ID cg06911149 and cg02428100 located into the exon 1 and cg03890664, cg15204119, cg15676203, cg26500801, cg26988016 located into the intron 1). (B) Inverse correlation of KEAP1 mRNA expression with the DNA methylation status in ccRCC. p: Spearman correlation coefficient.