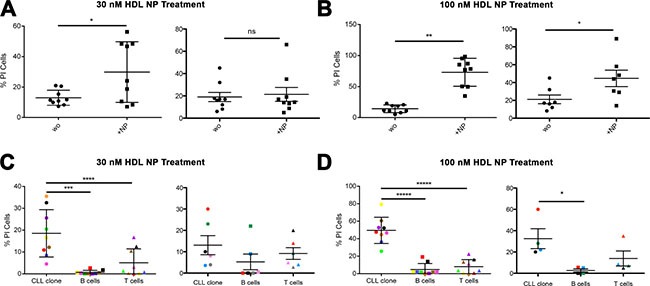
Figure 4. Effect of HDL NPs on CLL cells and normal B and T cells (patient samples).

(A) Percent of apoptotic PBMCs after treatment with HDL NP (30 nM) for 72 hours (USA, left: 13.0% ± 5.0% versus 29.9% ± 19.9% *p =0.0297; Italy, right: 19.8% ± 5.0% versus 21.3% ± 6.2%). (B) Percent of apoptotic PBMCs after treatment with HDL NP (100 nM) for 72 hours (USA, left: 14.2% ± 6.3% versus 73.0% ± 22.5% **p = 0.0001; Italy, right: 44.7% ± 9.1%, *p = 0.043). (C) Percent of apoptotic CLL, B cells (gate on CD19+ CD5− cells), T cells after treatment with HDL NPs (30 nM) for 72 hours (USA, left and Italy, right). (D) Percent of apoptotic CLL, B cells (gate on CD19+ CD5− cells), T cells (gate on CD3+ cells) after treatment with HDL NPs (100 nM) for 72 hours (USA, left and Italy, right). For (C) and (D), the % of CD19+CD5+ (CLL clone) cells, CD3+ cells (T cells) and CD19+CD5− B cells present in the patient's PBMC were analyzed, and the color code refers to patient number, as follows: (USA, left: Color, Patient, CLL clone %, B cell %, T cell %): Red, Patient 1, 72.93, 0.34, 2.55; Orange, Patient 2, 78.38, 3.57, 11.88; Yellow, Patient 3, 81.62, 1.14, 13.41; Green, Patient 4, 75.68, 6.51, 12.77; Blue, Patient 5, 72.55, 5.22, 6.01; Violet, Patient 6, 74.35, 1.34, 9.2; Brown, Patient 7, 72.89, 2.08, 13.07; Pink, Patient 8, 72.53, 2.37, 7.32; Black, Patient 9, 82.21, 0.75, 5.31). AND (Italy, right: Color, Patient, CLL clone %, B cell %, T cell %): Blue, Patient 3, 65, 17, 12.9; Grey, Patient 6, 85, 5, 5.2; Pink, Patient 7, 64, 8, 13.5; Green, Patient 11, 70, 14, 9; Black, Patient 15, 80, 9, 5; Red, Patient 19, 79, 3, 10.9).
