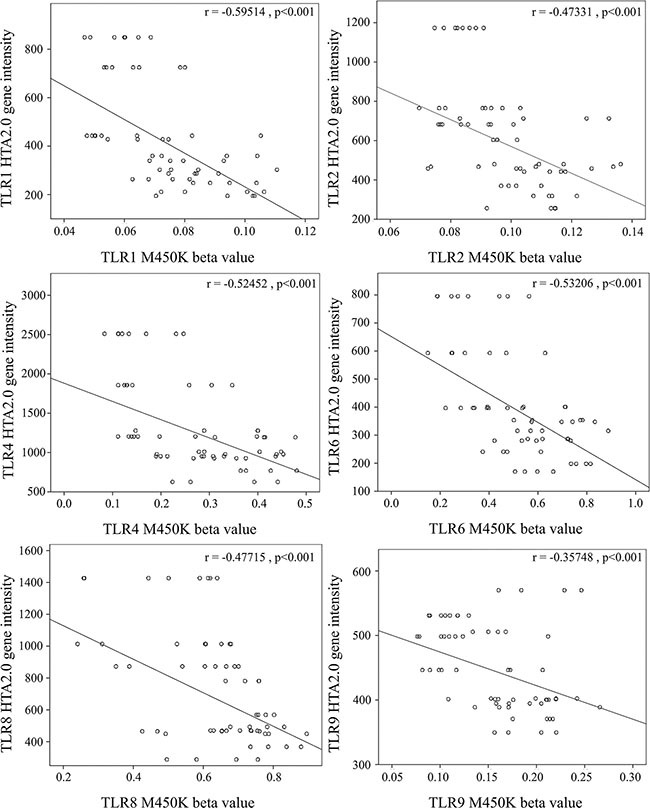
Figure 6. Correlation analysis of gene expression and CpG marker methylation.

The CpG markers corresponding to TLR1, 2, 4, 6, 8, and 9 are cg22839308, cg03523945, cg13730105, cg14578677, cg07759587, and cg21578541, respectively. We used scatter plots to demonstrate correlations between mRNA levels and DNA methylation. The results demonstrated that mRNA levels were negatively correlated with DNA methylation (Pearson's correlation coefficient around −0.4 and p < 0.001).
