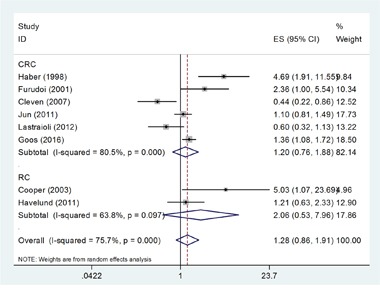
Figure 2. Forest plot diagrams of hazard ratios for correlations between GLUT-1 expression and OS.

The forest plot was stratified by cancer type. The pooled HR and 95%CI for OS were on the overall horizontal line. The horizontal axis indicates the pooled HR. ES (effect size) is HR in this figure.
