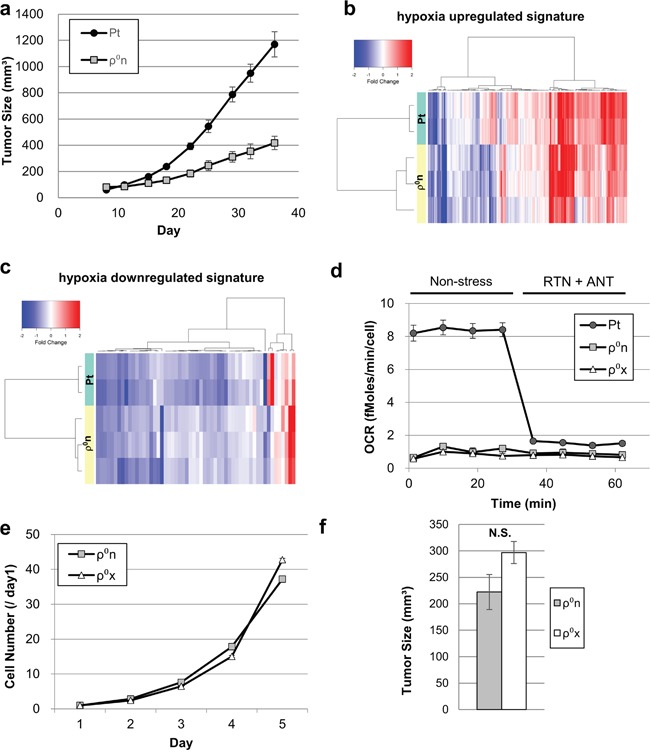
Figure 1. Hypoxic response activation in xenografted cells with or without mtDNA.

a. Growth of HT-29 ρ0n cell tumors (1 × 10⁷ cells/mouse) and HT-29 Pt cell tumors (1 × 10⁶ cells/mouse). b, c. Signal intensity ratios of gene expression. HT-29 Pt and ρ0n cells in xenograft were compared with those in culture. Comparisons were conducted using hypoxia-upregulated signatures in (b) and hypoxia-downregulated signatures in (c) (see gene lists in Supplementary Table 1 and 2). d. OCR in HT-29 Pt, ρ0n and ρ0x cells. After basal OCR was measured four times, rotenone (RTN, 0.5 μM) and antimycin A (ANT, 0.5 μg/ml) were added. e. In vitro growth ratio (/Day1) of HT-29 ρ0n cells and ρ0x cells. f. Tumor growth assessment comparing HT-29 ρ0n and ρ0x cells (1 × 10⁷ cells/mouse). Tumor volume was evaluated on day 24.
