
Figure 4. Mitochondria-enhanced HIF-1 transcriptional activity after HIF-1α stabilizing and translocating into the nucleus.
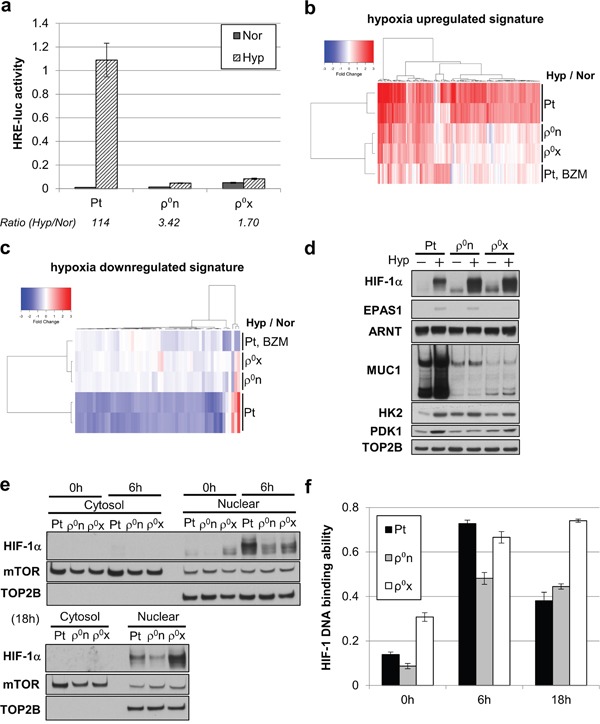
a. HRE-luc activity of HT-29 Pt, ρ0n and ρ0x cells after 18 hours of hypoxia (Hyp) and normoxia (Nor). b, c. Signal intensity ratio of gene expression, comparing HT-29 Pt, ρ0n, ρ0x and bortezomib (BZM)-treated Pt cells under hypoxia. Hypoxia-upregulated genes were used in (b) and hypoxia-downregulated genes were used in (c) (see gene lists in Supplementary Table 1 and 2). d. Immunoblot analysis of HIF-1α, EPAS1/HIF-2α, ARNT/HIF-1β and HIF-1-driven gene products (MUC1, HK2 and PDK1) after 18 hours of hypoxia. DNA topoisomerase IIβ (TOP2B) was used as a loading control. e-f. Immunoblot analysis of HIF-1α (e) and HIF-1 DNA-binding ability (f) in the same nuclear extracts of HT-29 Pt, ρ0n and ρ0x cells, at the indicated hypoxia durations. mTOR was used as a loading control, and TOP2B was used as a nuclear extract indicator.