
Figure 2. Negative correlation of USP44 gene expression and DNA methylation across 12 cancer types.
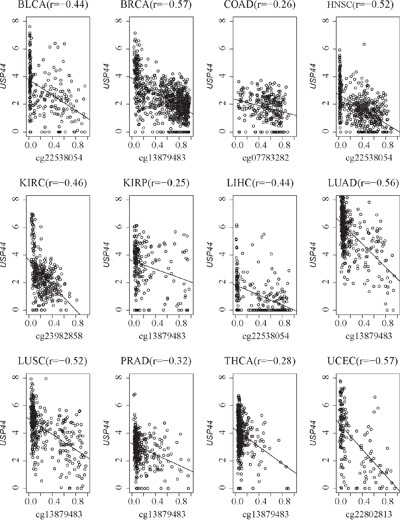
X-axis from 0 to 1 represents the beta value of the USP44 CpG sites in each cancer type. Y-axis from 0 to 8 represents the USP44 gene expression value (log2(RSEM+1)) across 12 cancer types.