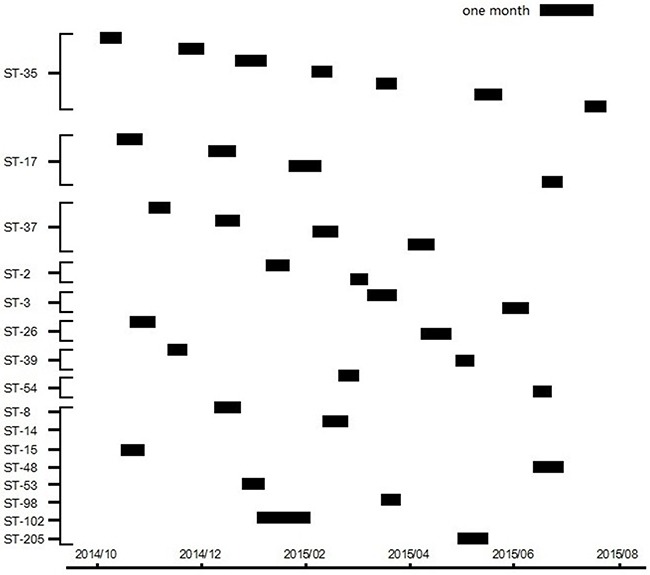
Figure 2. Time-space cluster map of different STs from individual CRC patients with C. difficile colonization.

Y-axis depicts unique multilocus STs. X-axis (bottom) shows the duration of the study period. Each small box represents the date of admission and the length of hospital stay of an individual C. difficile colonizing CRC patient.
