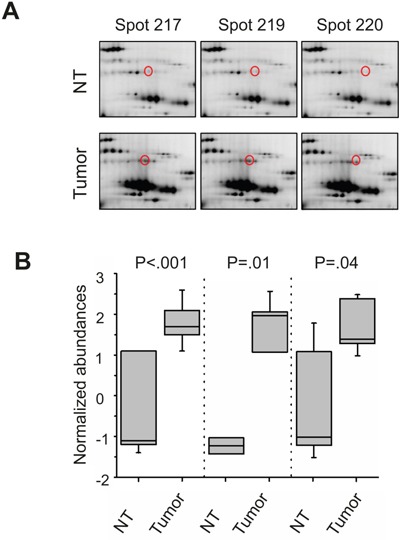
Figure 1. 2D DIGE analysis with enriched phosphoproteins of HCC tissue lysates.

Representative spot patterns from 2D DIGE analysis from one HCC-patient. eEF2(marked in red) in non-tumorous (NT) and corresponding HCC (tumor) liver tissue lysate, enriched for phosphoproteins of one HCC-patient A, B. Boxplots with the normalized abundances of the three eEF2 -isoforms of all 7 HCC-patients, which were analyzed in this study. Boxes represent 25th and 75th percentiles; whiskers indicate highest and lowest value. The median is shown as a horizontal line, and the mean value as a square within the box.
