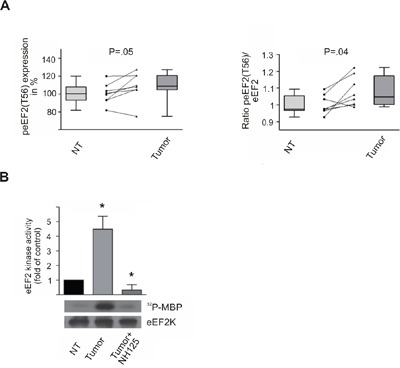
Figure 3. eEF2 kinase activity is increased in HCC tissue samples peEF2(T56) expression and eEF2 kinase activity in non-tumorous (NT) and corresponding HCC tissue (Tumor) assayed by immunoblotting.

A. Boxplots show the alteration of expression of peEF2(T56) in HCC tissue compared to non-tumorous tissue based on densiometric analyses of immunoblots (left panel). The ratio of peEF2(T56) to total eEF2 level shows a statistically significant increase 108% (P=.036) in tumor in comparison to non-tumorous cells. Boxes represent 25th and 75th percentiles; whiskers indicate the standard deviation. The median is shown as a horizontal line, and the mean value as a square within the box. The lines interconnect the corresponding HCC and NT tissue of single patients. B. EEF2 kinase activity was determined by in vitro kinase assay of non-tumorous and HCC-liver lysates. In tumor lysates the eEF2 kinase activity was significantly increased compared to non-tumorous lysates. As a control tumor lysates were treated with the eEF2 kinase inhibitor NH125 (3μM), which abolished kinase activity nearly completely. Activity of non-tumorous lysates was set to 100%. Immunoblots against immunoprecipitated eEF2 kinase confirmed that equal amounts of the kinase were put into the assay. * P<.01, all data are mean ± SE.
