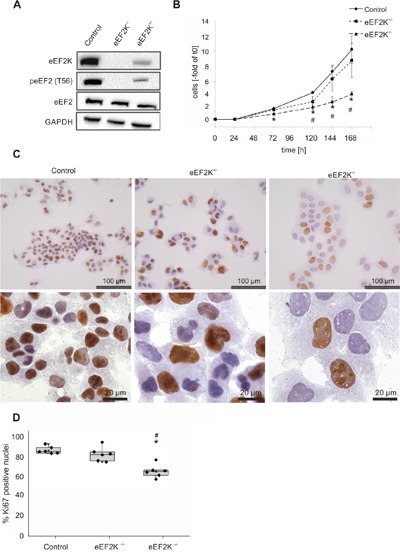
Figure 4. eEF2 kinase knock out in HCC cell lines leads to changes in proliferation.

A. Immunoblotting against eEF2K, peEF2 and eEF2 (GAPDH as loading control). In eEF2K-/− cells no phosphorylated eEF2 is detectable. eEF2K+/− cells show less kinase expression and therefore less eEF2 phosphorylation. B. Growth curves expressed as fold change of initially seeded cells for the three cell lines. Three independent experiments were carried out. * P<.01 eEF2K-/− compared to control, #P<.01 eEF2K+/− compared to control, the error bars indicate ±SD. C. Representative immunohistochemical Ki67 staining is shown. Of note the increased size of nuclei in eEF2K-/− and eEF2K+/− cells compared to controls. D. Boxplots with single data points illustrate the percentage of Ki67 positive nuclei. 120 nuclei were evaluated in six independent experiments respectively. In eEF2K-/− cells significantly less nuclei are stained compared to control cells (* P<.01) and eEF2K+/− (# P<.01) (Control: 84%, eEF2K-/− 68%, eEF2K+/−: 81%).
