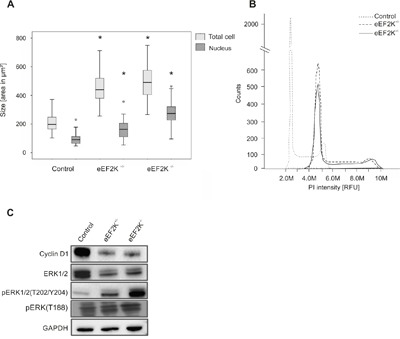
Figure 5. EEF2K-/− cells show alterations in morphology, DNA content and protein expression.

A. Boxes represent cell size and nucleus size of eEF2K-/− and eEF2K+/− cells are significantly increased compared to controls, *P<.01. 100 cells and nuclei were analyzed and boxes represent 25th and 75th percentiles; whiskers indicate the standard deviation. The median is shown as a horizontal line, and the mean value as a square within the box. B. Flow cytometric analysis of PI stained nuclei is shown. The histogram shows a peak shift to higher propidiumiodid fluorescence intensities occurring in eEF2K knock out cells indication increased DNA content. C. Representative immunoblots of control cells, eEF2K+/− and eEF2K-/− cells stained with antibodies against Cyclin D1, ERK1/2 and pERK1/2(T202/Y204) and GAPDH as loading control. The antibody against pERK(T188) detects ERK1/2 phosphorylation at T188 and ERK2 phosphorylation at T208. eEF2K-/− cells express less Cyclin D1 and show increased phosphorylation of three ERK phosphorylation sites while total ERK1/2 is less expressed.
