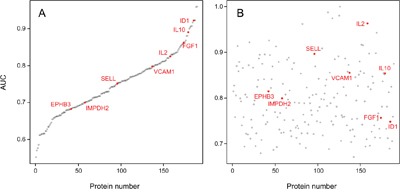
Figure 2. AUC values of the 189 individual serum markers.

Analysis by Receiver Operating Characteristic (ROC) curves was performed for all identified serum protein markers individually. Panel A shows the result calculated from the training set; the respective AUC values are shown, ranging from 55.2% to 96.0%. In panel B, the AUC values are shown as calculated for the individual marker molecules in the test set. For presentation, the order of the markers along the x-axis was kept as in panel A, highlighting the limited degree of reproducibility for individual markers.
