
Figure 5. Second harmonic generation (SHG) imaging of control and LOXL4-knockdown primary tumor tissues.
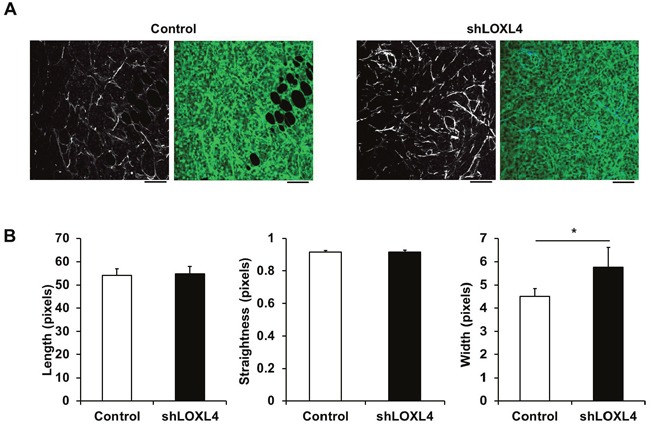
A. Representative SHG images alone (left) and overlaid with the fluorescence images of control and LOXL4-knockdown primary tumor tissues (right). B. Quantification of collagen fiber lengths, straightness, and widths in control and LOXL4-knockdown primary tumor tissues. n = 5. *P < 0.05. Scale bar: 100 μm.