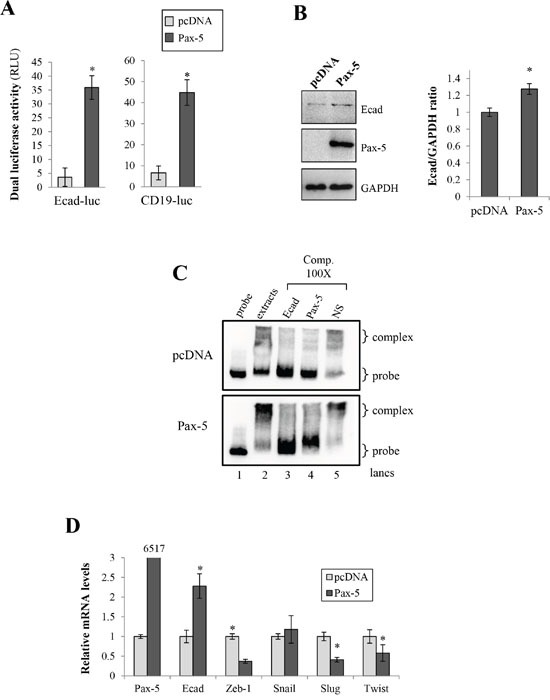
Figure 6. Pax-5 induces E-cadherin expression in breast cancer cells.

A. MB231 cells transfected with either the empty vector (pcDNA) or Pax-5 were analyzed for E-cadherin (left panel) and CD19 (right panel) promoter transactivation potential using dual reporter gene assays (Promega) with Ecad-luc and CD19-luc (Pax-5 responsive reporter) constructs respectively. Normalization of firefly luciferase activity was performed using non-inducible Renilla luciferase and plotted in relative light units (RLU) in relation to parental cells. B. E-cadherin was monitored in transfected cells by Western blot (left panel) where protein density was quantified and plotted using the ImageJ software plotted (right panel). C. Electrophoretic Mobility Shift Assays (EMSA) were conducted on nuclear extracts from Pax-5 transfected BT549 cells and mixed with biotin-labelled probes corresponding to a partial region of the E-cadherin promoter. DNA-protein complexes were resolved and analyzed on a 4% polyacrylamide gel. Specific (Ecad and Pax-5) and non-specific (NS) cold competition (Comp.) assays were carried out by adding a 100-fold molar excess of unlabeled dsDNA oligonucleotides corresponding to the E-cadherin (Ecad) or the Pax-5 consensus binding motif. Control lanes were loaded with free probe (probe) and extracts from empty vector transfected cells (pcDNA). D. Transfected cells were also monitored for Pax-5, E-cadherin, and E-cadherin suppressors (Zeb, Snail, Slug and Twist) using RT-qPCR. The presented data is the calculated mean of three independent experiments where statistical analysis was determined by t-test in respect to control cells (* p<0.01).
