
Figure 2.
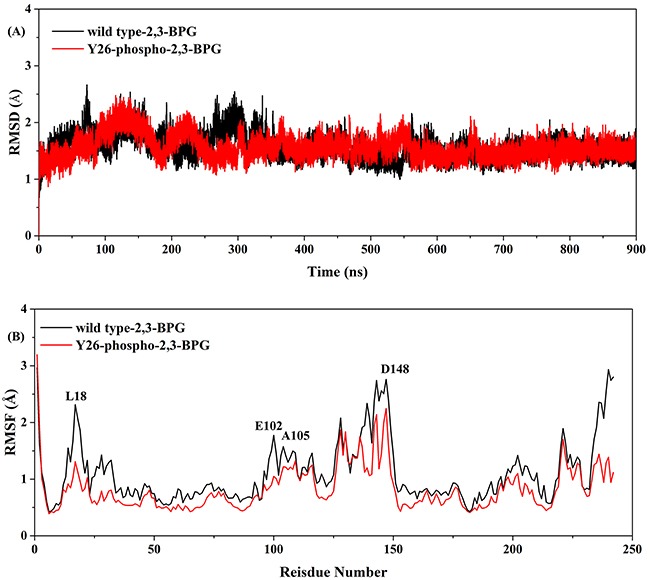
A. The time course of RMSD values of the wild type system (black) and the Y26-phospho system (red). B. The time course of RMSF values of the two systems. Those residues with high RMSF values are labeled.
Official websites use .gov
A
.gov website belongs to an official
government organization in the United States.
Secure .gov websites use HTTPS
A lock (
) or https:// means you've safely
connected to the .gov website. Share sensitive
information only on official, secure websites.
A. The time course of RMSD values of the wild type system (black) and the Y26-phospho system (red). B. The time course of RMSF values of the two systems. Those residues with high RMSF values are labeled.