
Figure 3. Frequency of hydrogen bond formation between 2,3-BPG and its adjacent PGAM1 residues, for both the wild type system (upper panel) and the Y26-phospho system (bottom panel).
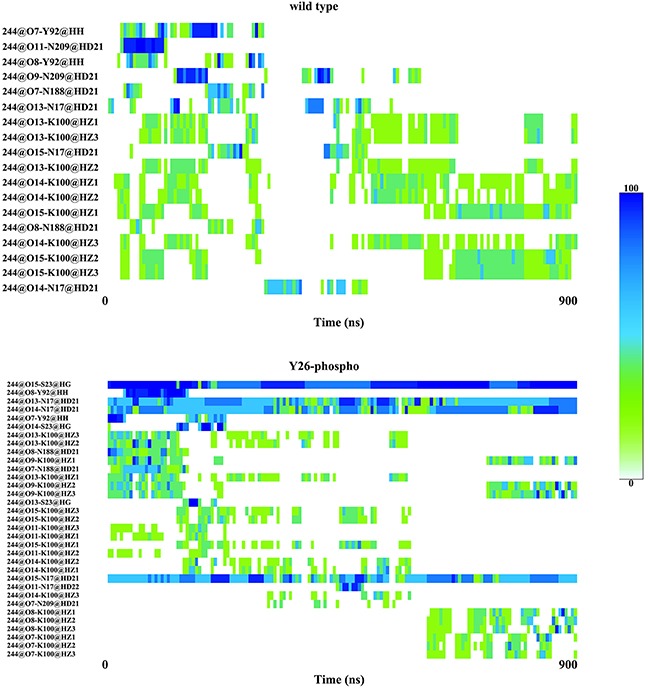
The rows correspond to various hydrogen bonds formed. The columns correspond to time zones.