
Figure 6. Porcupine plots for S3 wt (cyan) and S0 phos (orange).
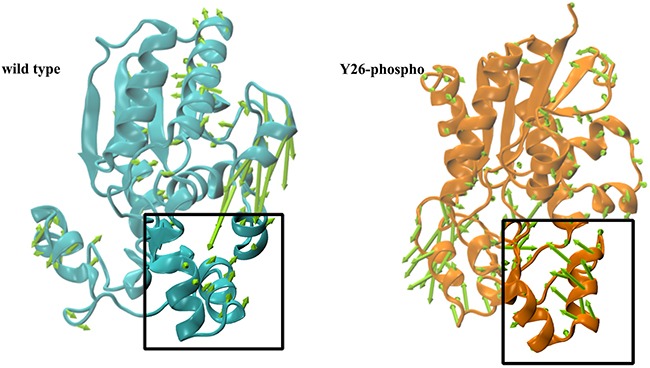
The conic arrows indicate directions of movement corresponding to the first principal component. The α-helix region is boxed.
Official websites use .gov
A
.gov website belongs to an official
government organization in the United States.
Secure .gov websites use HTTPS
A lock (
) or https:// means you've safely
connected to the .gov website. Share sensitive
information only on official, secure websites.
The conic arrows indicate directions of movement corresponding to the first principal component. The α-helix region is boxed.