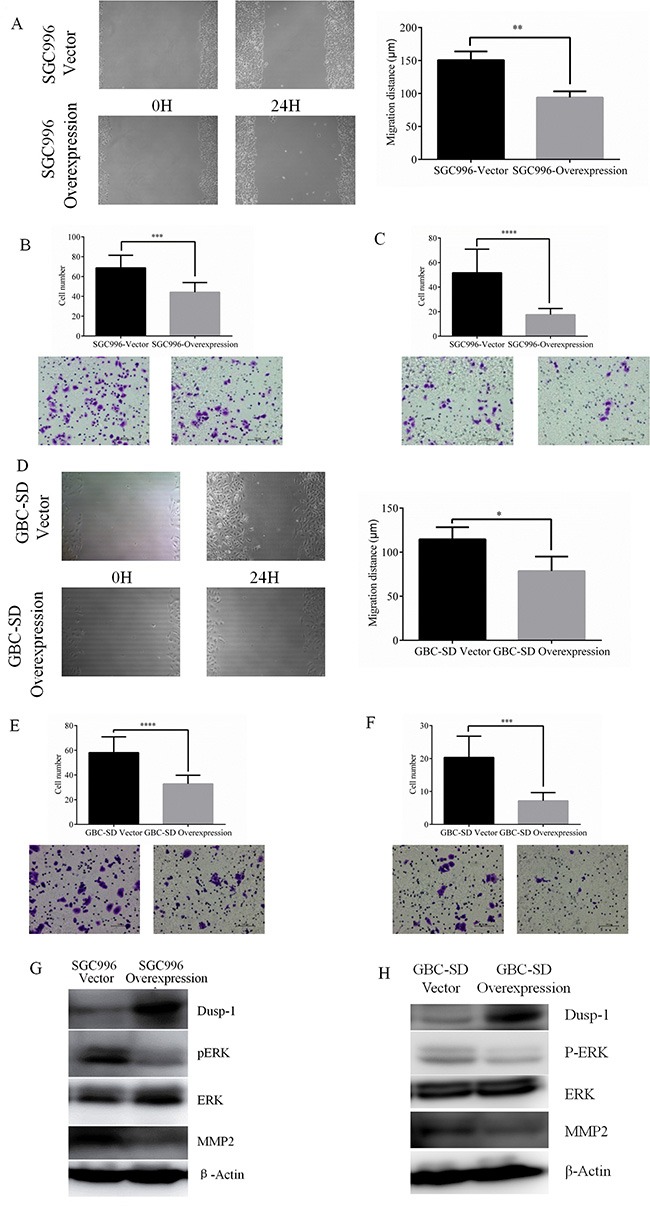
Figure 3. Representative images of wound-healing assay of SGC996 and relative wound space was calculated.

(A) Representative images and quantitatively analysis of migrated SGC996 cells expressing DUSP1 versus vector control (B). Representative images and quantitatively analysis of invaded SGC996 cells expressing DUSP1 or vector control (C). Representative images of wound-healing assay of GBC-SD and relative wound space was calculated (D). Representative images and quantitatively analysis of migrated GBC-SD cells expressing DUSP1 versus vector control (E). Representative images and quantitatively analysis of invaded SGC996 cells expressing DUSP1 or vector control (F). Western blot analysis results show higher expression of DUSP1 and lower expression of pERK and MMP2 in the two Dusp1 overexpression GBC cells (G, H). (*P < 0.05, **P < 0.01, ***P < 0.001, ****P < 0.0001).
