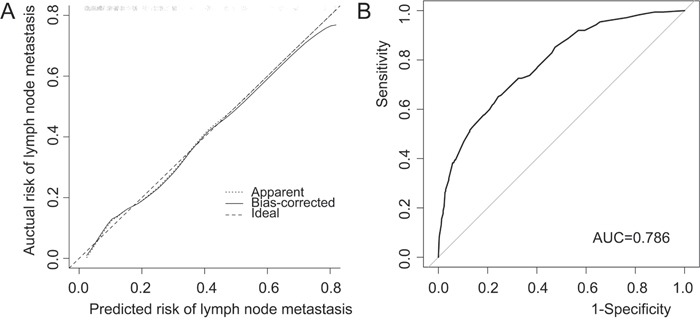
Figure 2. Validation of nomogram for predicting lymph node metastasis in early gastric cancer patients.

A. Calibration plot. After 500 repetitions, the bootstrap-corrected calibration curve (solid line) lay close to the ideal reference line (dashed line), which demonstrated a perfect agreement between the predicted and actual outcomes (mean absolute error = 0.013). B. Discrimination plot. After 2000 bootstrap repetitions, the receiver operating characteristic analysis demonstrated that area under curve was 0.786 (95% CI, 0.749 to 0.822).
