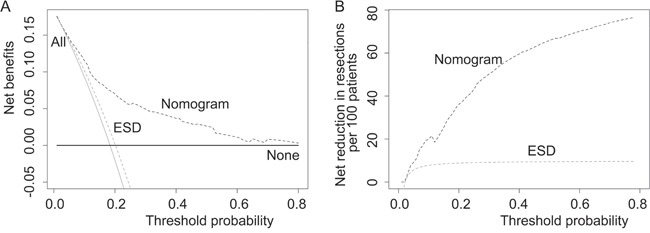
Figure 3. Clinical performance of absolute indication for ESD and the nomogram.

A. Decision curve analysis on absolute indication for ESD and the nomogram. The y-axis represents net benefits, calculated by subtracting the relative harms (false positives) from the benefits (true positives). The x-axis measures the threshold probability. A treatment strategy is superior if it has the highest value compared with other models, including two simple strategies, such as performing surgery for all patients (sloping solid line) or no patients (horizontal solid line). For example, the value of net benefits would be 0.115 if we select 10% as cutoff value, which means that nomogram would find about 11 patients with lymph node metastasis among one hundred patients compared with simple observation, without adding any unnecessary resections (false positives) theoretically. B. When assessing the clinical utility of two models, we sometimes are more interested in whether nomogram would reduce unnecessary gastrectomy. At the same cutoff of 10%, nomogram would reduce the unnecessary resection rate by 20%, without missing any cancers.
