
Figure 2. Gene expression analysis and signal network of apoptotic genes.
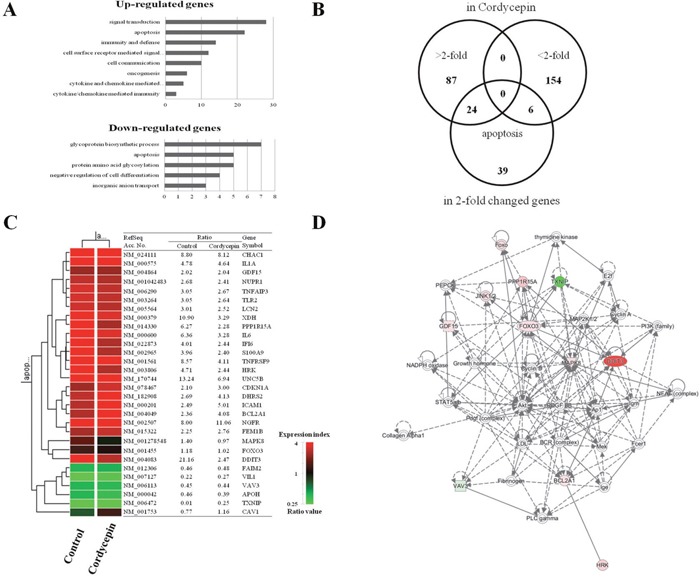
A. Results of microarray analysis of gene expression in response to 60 μg/mL of cordycepin for 48 h. Genes showing twofold upregulation or downregulation identified for Gene Ontology analysis B. Venn diagram of gene expression in response to cordycepin genes that were altered more than twofold and apoptosis-related genes. C. Apoptosis-related genes lists that were altered more than twofold in response to cordycepin. D. Signal network of the apoptotic genes generated by using a Qiagen IPA.