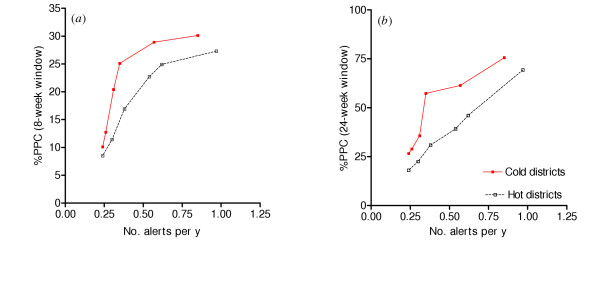
Figure 3.
Comparison of performance of prediction systems in cold and hot districts. Percent of PPC by number of alerts per year. PPC was obtained from cases in excess of the weekly mean (low effectiveness) with windows of effectiveness of eight weeks (a) and 24 weeks (b). The solid lines represent cold and the dotted lines hot districts.

